Tutorial
Tutorial A : Period over period comparison cards in Tableau
Tutorial A : Period over period comparison cards in Tableau

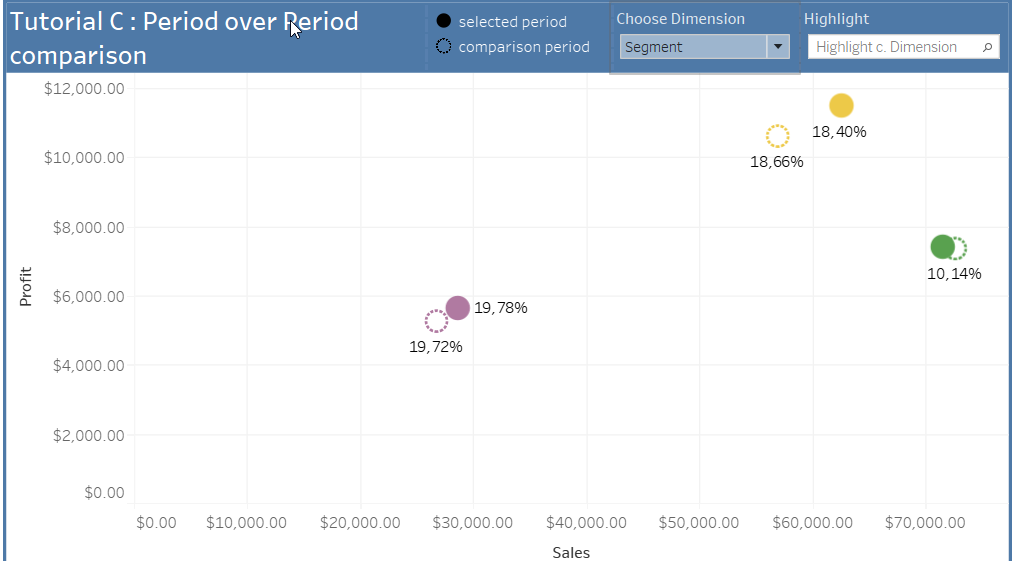
A question I get often is how to realize period over period comparisons in Tableau. It is pretty straightforward to display a filtered period in Tableau but what if you want to compare this period with some equivalent in the past ? If you actually want to have an analysis such as Year on Year evolution, quarter over quarter or month over month evolution. Comparisons periods in Tableau is a big chapter so we split it in 4 related tutorials. At the end of the tutorial series, this is what we will have achieved :
1/ Define a period with parameters
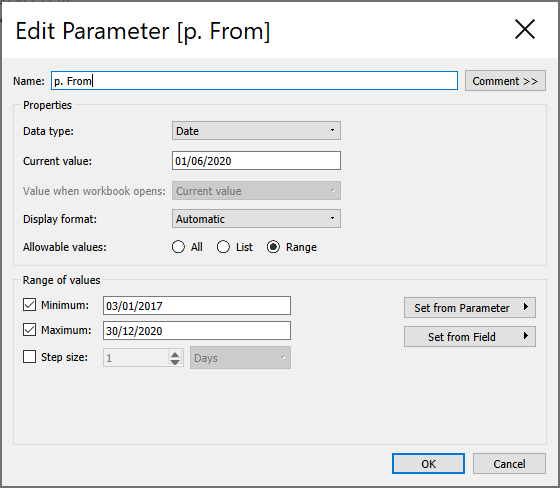
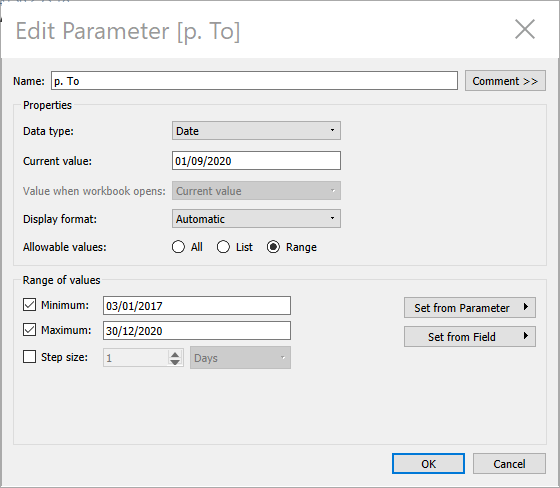
There can be a few ways you can define a period in Tableau. We cannot use your typical filters since these will filter out the comparison period we want to display. This is why we are going to go with Tableau Parameters here. Define two date parameters [p. From] and [p. To] as follows :
Then you can define a Calculation (we will use it as a filter) that returns True if the date you are interested in is inside both parameters.
[Order Date] >= [p. From] AND [Order Date] <= [p. To]

And that’s it ! If you want to test it, you can drag & drop [f. Is This Period] to the filters and you’ll see it’ll filter out any data that is not inside both parameters.
2/ Define a comparison period with a parameter
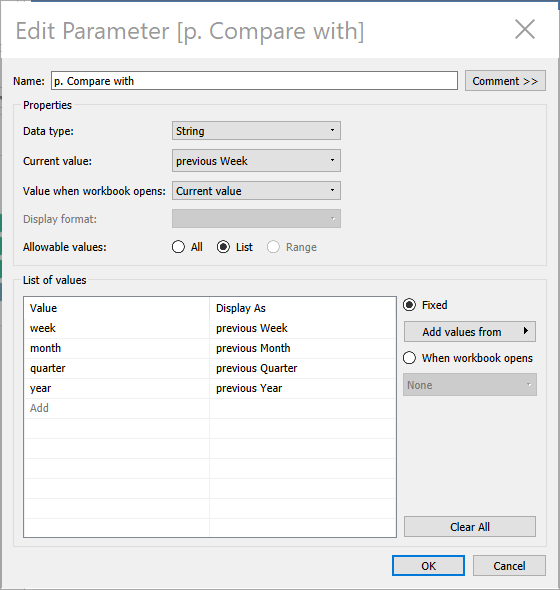
Now that we have a selected period, we might want to compare some KPIs with a comparison period. An easy way to do this is to use the DATEADD Function. Just create a String Parameter [p. Compare With] with the following values : week, month, quarter and year. Then, change the aliases of each value as follows :
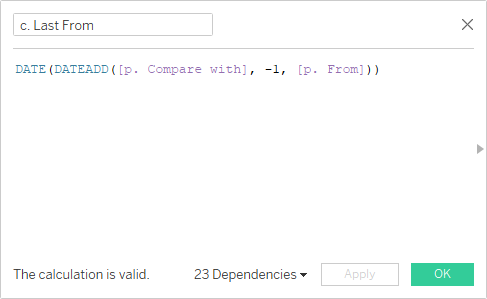
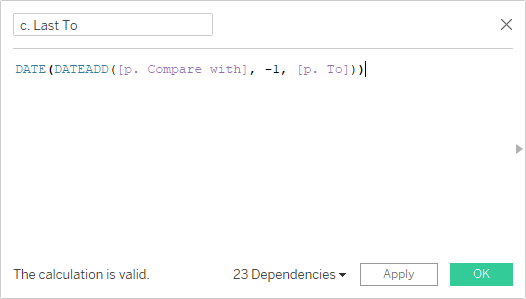
We will use this parameter to go 1 week or 1 month, 1 quarter or 1 year in the past from a given period. Create 2 calculated fields [c. Last From] and [c. Last To] as follows :
DATE(DATEADD([p. Compare with], -1, [p. From]))
DATE(DATEADD([p. Compare with], -1, [p. To]))
Now that we have the 2 extremum dates for the comparison period, we can work out the following calculation field (used as a filter) :
[Order Date] >= [c. Last From] AND [Order Date] <= [c. Last To]

Now that we have both periods, we can filter out any data that is not inside one period or the other :
[f. Is Last Period] OR [f. Is This Period]

[Optional] You can put this last calculated field on filters and add it to the context if you want. By filtering out data that is not relevant it should increase performance of your queries.
3/ Create period-specific metrics
Now that we have the periods defined, we need to create 4 calculated fields per metric :
- [c. This Metric] : metric for the selected period
- [c. Last Metric] : metric for the comparison period
- [c. Metric Evo] : rate of evolution from comparison period to the selected period
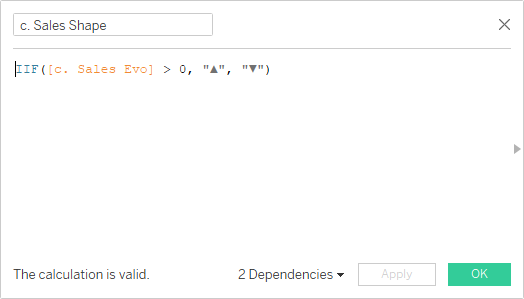
- [c. Metric Shape] (optional) : arrow that will be turned up if Metric grows and down if Metric decreases
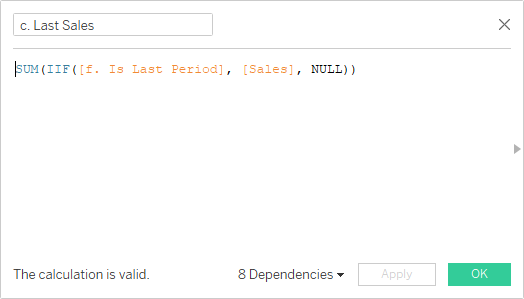
We are going to make these steps for the following metrics : Sales, Profit and Profit Ratio. As you can see, we define metrics by period relying upon Tableau built-in function IIF(condition, output if true, output if false).
Here is what it can look like for the Sales Metric :

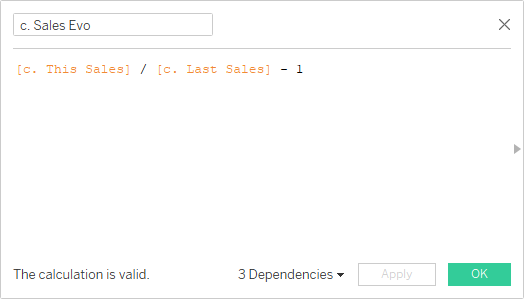
Take the time to change the default Number format to currency for [c. This Sales], [c. Last Sales] and to percentage for [c. Sales Evo].

Finally, drag & drop the 4 fields to Text on Marks. Make sure it looks good, design is important ! Here what it could look like :

You now have in a single card a view of your metrics for the selected period as well as a comparison period, giving your users a view on how they display the data.
Repeating this step for as many metrics as you'll want and you could create a dashboard looking like this:

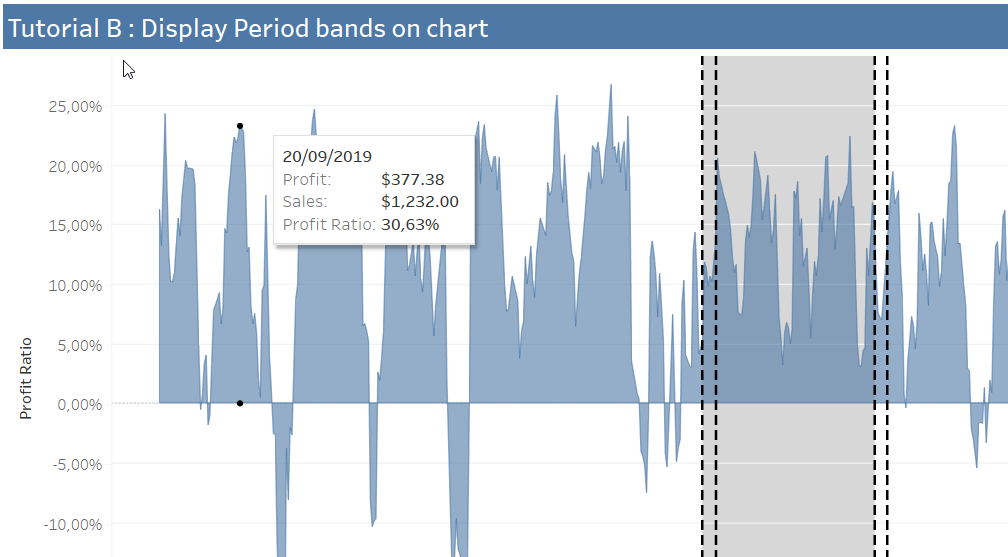
There you go! I strongly recommend you follow this 3-tutorial series on period of period analysis. In the next tutorial Period bands for period over period analysis we will see how to display a user-friendly view of what each period represent on a timeline.
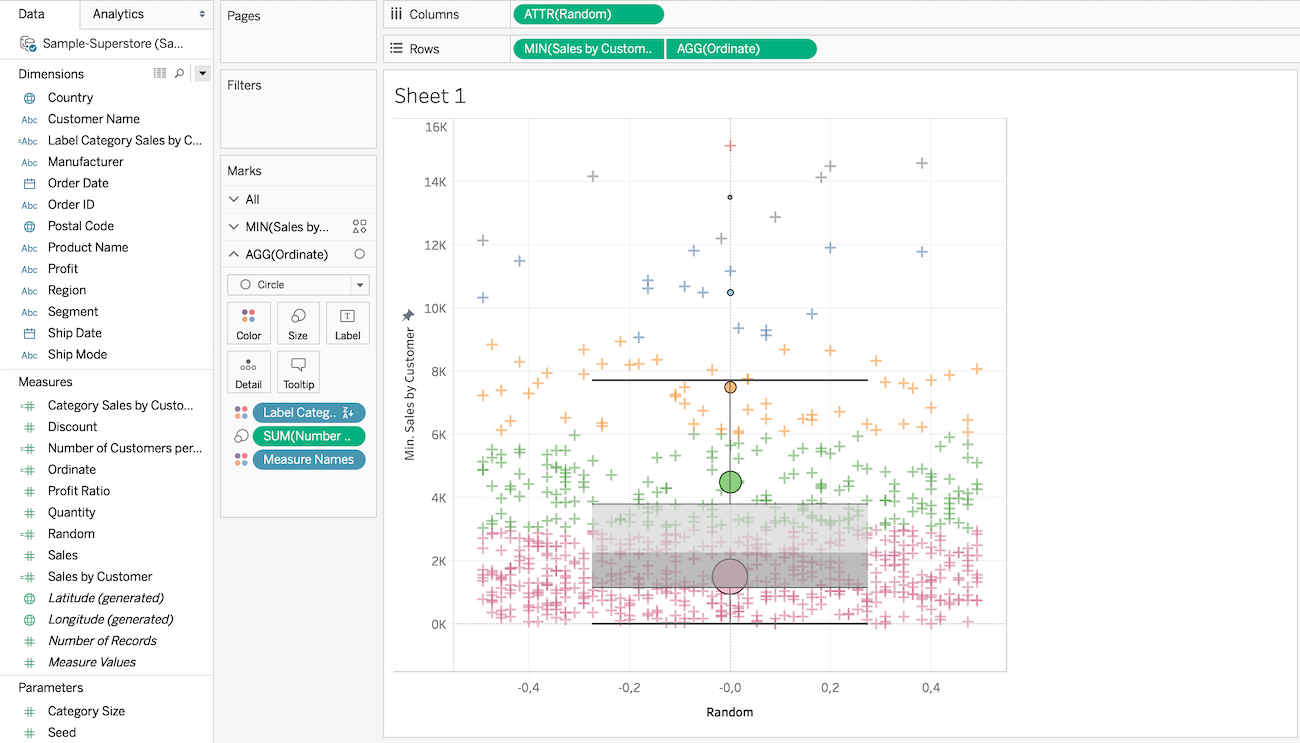
How to use box plots and point clouds in Tableau